

When forecasting how your retirement savings will last, we use Monte Carlo simulations. This estimates the probability that your retirement savings will last the distance.
Monte Carlo simulations randomise a series of returns. They are named after the Monte Carlo casino in Monaco. I like to think probability is like rolling the dice and how often the number 6 comes up. The name was coined in the 1940s by scientists working on the Manhattan (hydrogen bomb) Project. They used random-number-based calculations to solve difficult problems involving probability.
It is easy to take an average return and project it over say, 30 years of retirement. It would be based on your level of portfolio risk and asset allocation plus the level of drawings (regular income) that you would expect to have. This is similar to the retirement calculator on our web site.
The problem is that this can lead to a false sense of security – markets do fluctuate.
Dollar cost ravaging
Dollar cost ravaging, not to be confused with dollar cost averaging.
Often financial advisers will recommend investing into a volatile market using ‘dollar cost averaging’.
Dollar cost averaging is an investment strategy where you invest a fixed amount of money regularly (such as monthly), regardless of the asset’s price. This means you buy more units when prices are low and fewer units when prices are high, which can help lower your average purchase price over time and reduce the impact of market volatility.
The impact of volatile markets is amplified when you are in retirement and drawing an income from your retirement funds – this is dollar cost ravaging.

In the above graph two portfolios start at $500,000, drawing out $25,000pa. Both portfolios have the same average return but opposite sequencing. In the first year the blue portfolio returns +10% and the orange portfolio -5%. At the end of 24 years the blue portfolio is worth $94,069 and the orange portfolio $36,079.
Wade Pfau (director of retirement research at McLean Asset Management) found the first 10 years of retirement determines 77% of the outcomes. The first year alone drives 14% of the outcomes.
How can an investor’s returns be lower than the market return?
Investors’ behaviour biases can destroy wealth. Biases such as loss aversion, over confidence, herd mentality, and confirmation bias, can lead to panic selling and delayed market re-entry.
Morningstar research in their Mind the Gap 2025 report found over the 10 years ending 31 December 2024 investors had a 1.2%pa lower return than the total fund return over this period. This shortfall meant investors captured only about 85% of the returns generated by their funds—roughly 15% of potential returns lost. A 1.2%pa difference in return compounding over 10 years on an initial $100,000 investment is a loss of $12,743 – not insignificant.
Refer also to our previous articles:
Staying the course vs timing the markets
The value of financial advice
Projections and simulations
To address the potential impacts of market volatility on future drawings we use Monte Carlo simulations.
Monte Carlo calculations help with retirement planning by simulating a wide range of possible outcomes for your investment portfolio, while allowing for the variability and uncertainty of market returns. This approach allows us to see not just the most likely scenario, but also optimistic and conservative outcomes, helping you to plan for both good and bad market conditions.
At Lyfords we run these simulations using your retirement funds and your risk-return profile to randomise portfolio returns over 500 to 1,000 iterations, factoring in historical correlations between different investments. This provides a realistic view of how your retirement savings are likely to perform. It also helps you to understand the probability of achieving your retirement goals, including the risk of outliving your assets.
Graphically this looks like:
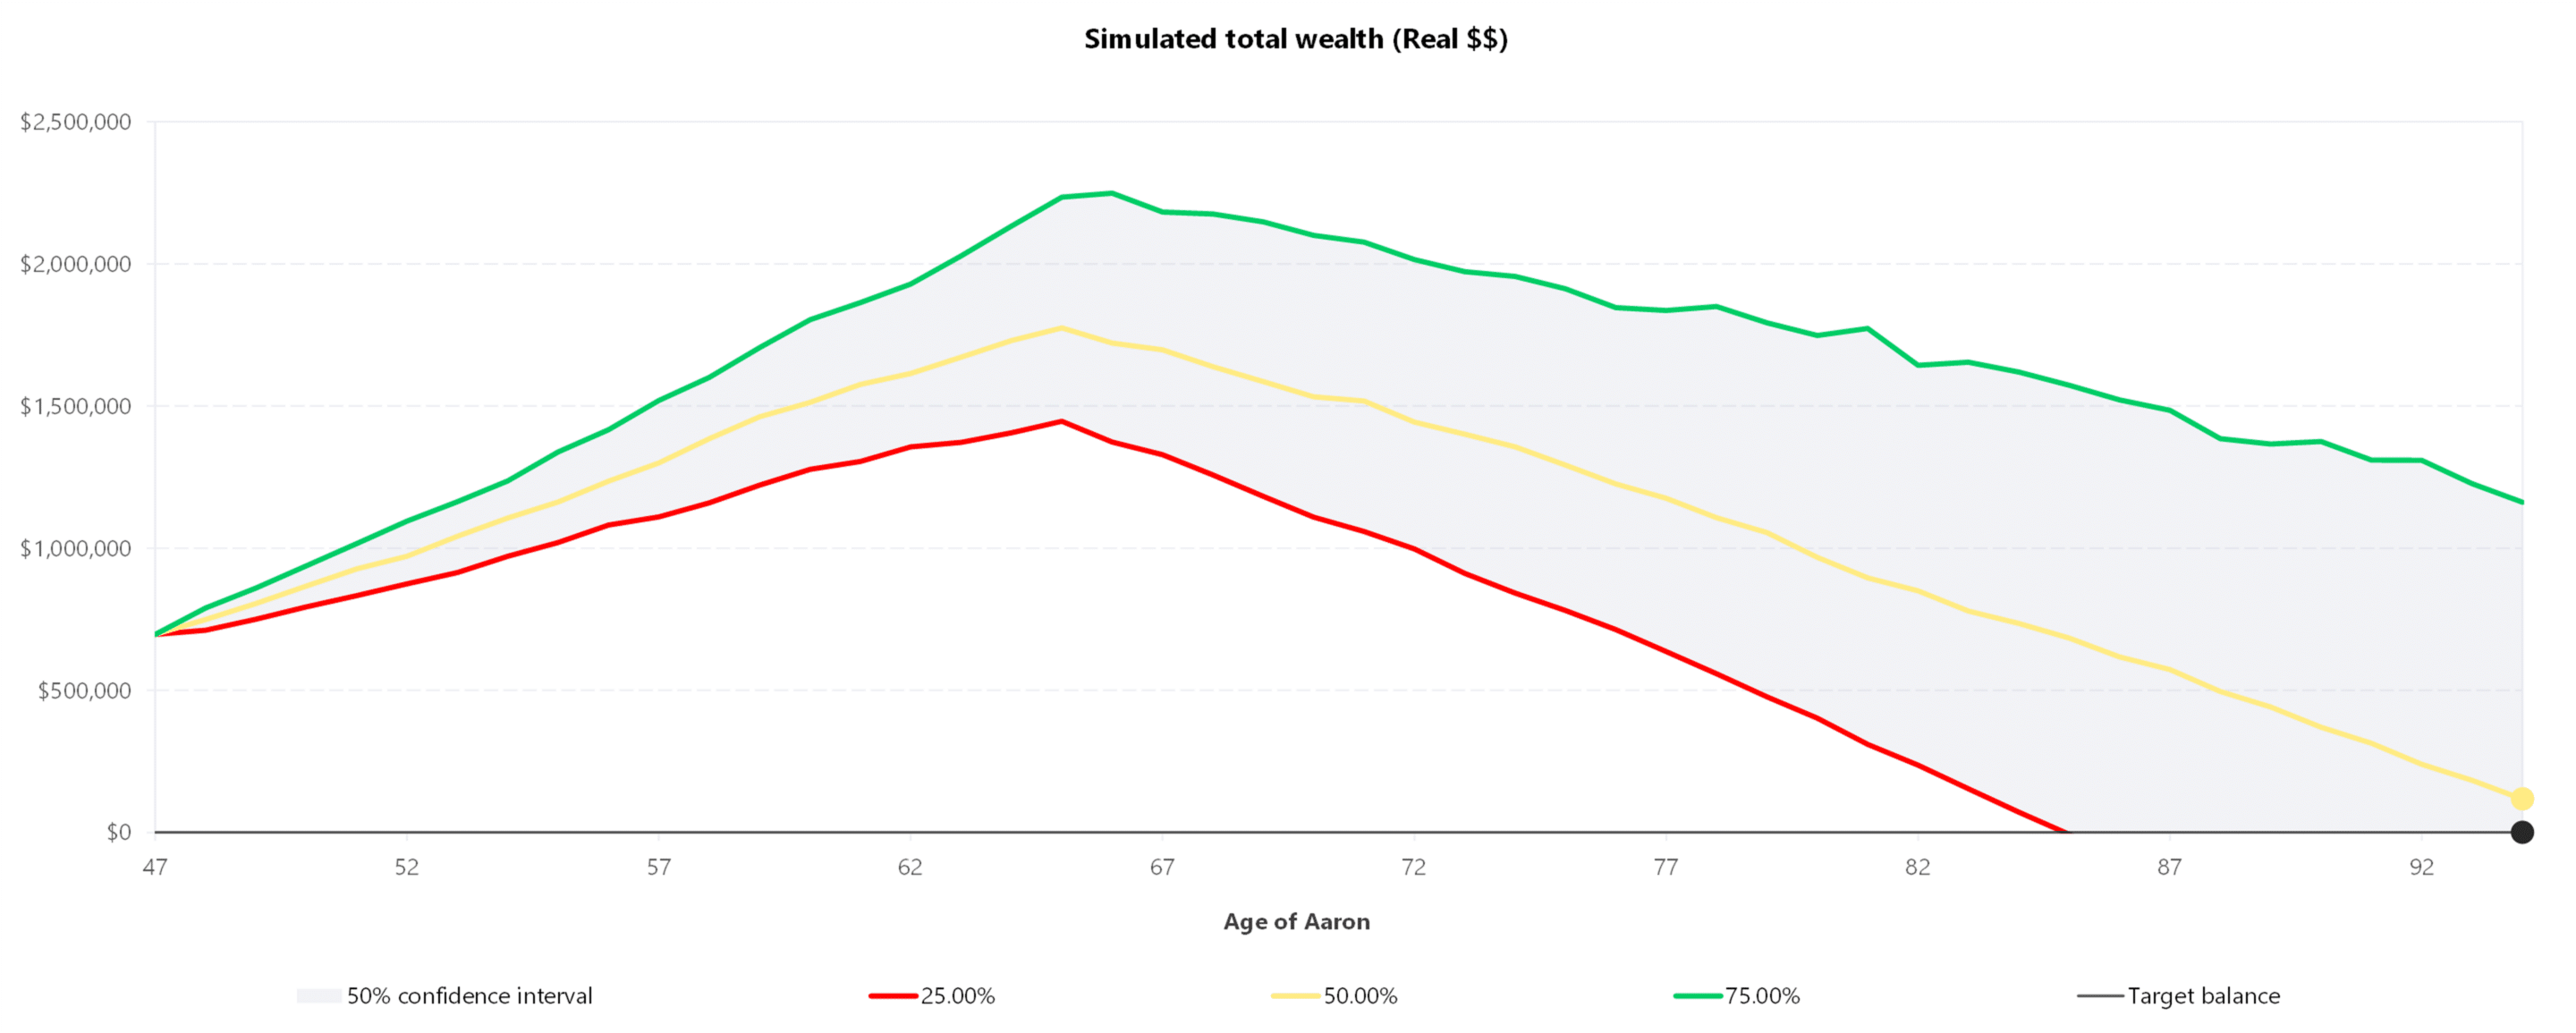
Where the yellow line represents the most likely outcome, the red line the pessimistic outcome and the green line the most optimistic. We usually allow some residual balance at the end to provide a safety net. If you are conservative, then you would want the red line, which shows the client’s funds could run out by age 85, to move to the right.
From the data we can calculate the probability of success and compare this with the target success we previously determined.
As mentioned above, market volatility can impact the outcomes. It is important to track the success and whether you remain on target over the years.
Tracking your retirement over time
By tracking the probability of success that your retirement plans will last the distance we can make adjustments along the way to keep you on track. In the graph below the dash line is our target success rate and the circles are the calculated success for that year based on what value your funds are and our projected returns.

If the dots are in the green band, all is OK. If they move to the yellow band we need to closely monitor this over the next year. If they move into the red band then action needs to be taken to stay on track. This could be, increase your risk-return profile, or spend less, or delay spending on say a holiday.
In summary, Monte Carlo projections are not about predicting exactly what will happen, but about helping you understand the range of possible outcomes and the likelihood of your retirement savings lasting the distance. By allowing for market volatility, sequencing risk and changing investment conditions, these projections provide a more realistic framework for retirement planning.
Most importantly, they give us a way to monitor progress over time and make informed adjustments where needed, helping you stay on track with greater confidence throughout your retirement.